[Splunk] - Discovery/Recon Detection on Windows Hosts
Virtual machines to power on:
DC
WIN11V
Once a threat actor finds themselves in an environment, they will most likely need to undertake some kind of reconnaissance activities. The MITRE ATT&CK Discovery section contains 32 techniques, with various sub techniques: https://attack.mitre.org/tactics/TA0007/
Like many other sections in this course, this is one where you can deep dive into - for our purposes however, rather than covering how to detect each and every single discovery technique, let's spend some time on how to approach these types of detections more broadly.
Looking at one of the fantastic DFIR Report write-ups ( https://thedfirreport.com/2023/10/30/netsupport-intrusion-results-in-domain-compromise/ ), we can get a quick since of what discovery looks like when executed by a threat actor:
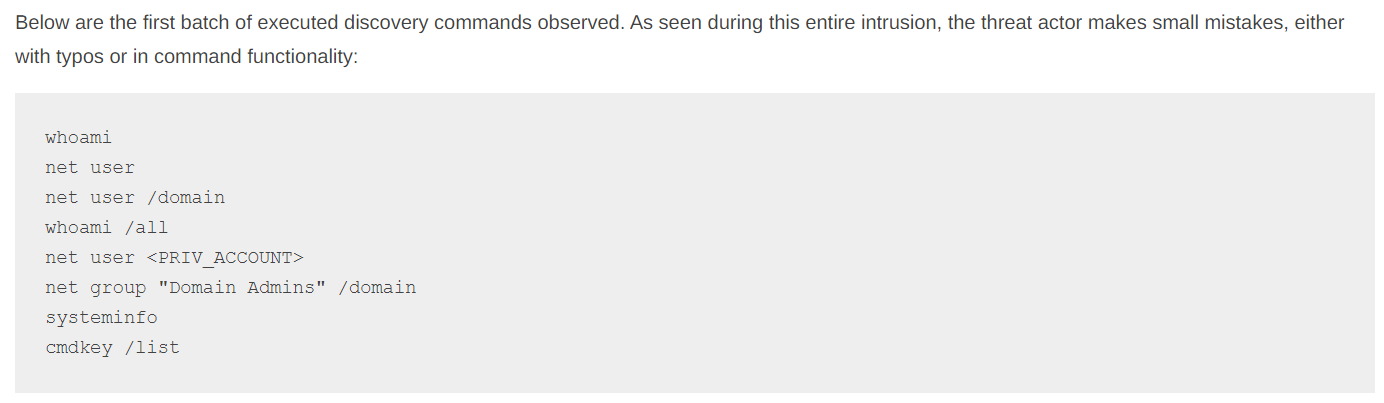
Let's go ahead and issue some of these commands on our Win11V host, in a command prompt:
whoami
net user
net user /domain
whoami /all
net user Administrator
net group "Domain Admins" /domain
systeminfo
cmdkey /list 
Let's start with a broad query, looking at Sysmon events and displaying what command lines were issued by a parent command line:
index=sysmon EventCode=1
| stats values(CommandLine) as CommandLines by ParentCommandLine
And looking at our results:

Without specifically looking for our recon commands, we see them generally stick out when looking at our telemetry. Let's filter this query down further and look for specific recon commands:
index=sysmon EventCode=1
| regex CommandLine="(net group|net user|cmdkey|systeminfo|whoami)"
| stats values(CommandLine) as CommandLines,count(CommandLine) as ReconCommandCount by ParentCommandLine
In this query, we are:
Looking at Sysmon Event ID 1 Process Creation events
Running a regular expression that looks for recon commands, we can add more here as we discover additional potential recon commands
Displaying the values of the command line and counting how many times a recon command was found, sorted by the ParentCommandLine
And looking at our results:

If you recall, we ran some recon commands like whoami through some of our earlier executions, so let's broaden the time frame of the query and look at the results - since we are looking at a broader time period ( try something like 7 days, this will depend on when you performed the prior executions ):
index=sysmon EventCode=1
| bin span=1d _time
| regex CommandLine="(net group|net user|cmdkey|systeminfo|whoami)"
| stats values(CommandLine) as CommandLines,count(CommandLine) as ReconCommandCount by ParentCommandLine,_time
And our results:

We see the recon commands that we just ran, as well as our previous WMIExec execution - and we also see some other recon commands that we ran, either in the course of building the lab, troubleshooting or maybe our PSExec executions.
The discovery / recon category is one where it is extremely difficult to gain an understanding of whether a particular execution is actually malicious or not. Counting the number of recon commands per user, per process or per time period is a great approach, but it lacks context - that is, do we know whether a particular recon command was issued for the first time?
This temporal element is very important, if an administrator runs whoami, ipconfig etc every day or even every week in the context of their job duties, this is probably expected behavior, however, if that same administrator runs a recon command for the first time in a given time period, this might be a little bit more suspicious.
Let's narrow our query time frame from the above 7 days and add a timechart operator:
index=sysmon EventCode=1
| bin span=1d _time
| regex CommandLine="(net group|net user|cmdkey|systeminfo|whoami)"
| timechart span=1d values(CommandLine) as ReconCommands,count(CommandLine) as ReconCmdCount by Computer
This query is similar to our previous ones, utilizing the same regular expression. However, this query adds a timechart operator that will break the commands and counts down for us per a one-day period, and divided by the computer name on which they were executed:

Now, instead of tweaking the query itself to bubble up suspicious activity, let's use some Splunk features to add some color to our table.
Click the little paintbrush icon next to one of the fields with a numerical value:

Then, within the Color section, click on the "None" dropdown and select "Scale":

Under the "Presets" select anything in the "Divergent" column.
Now, your table will be color coded according to high and low numerical values, the higher the number, the higher the shade of color:

The goal in this section isn't to provide queries for every possible recon command available, as that would be infeasible, but rather to highlight different strategies and techniques that can be used to detect this type of activity.
References:
-
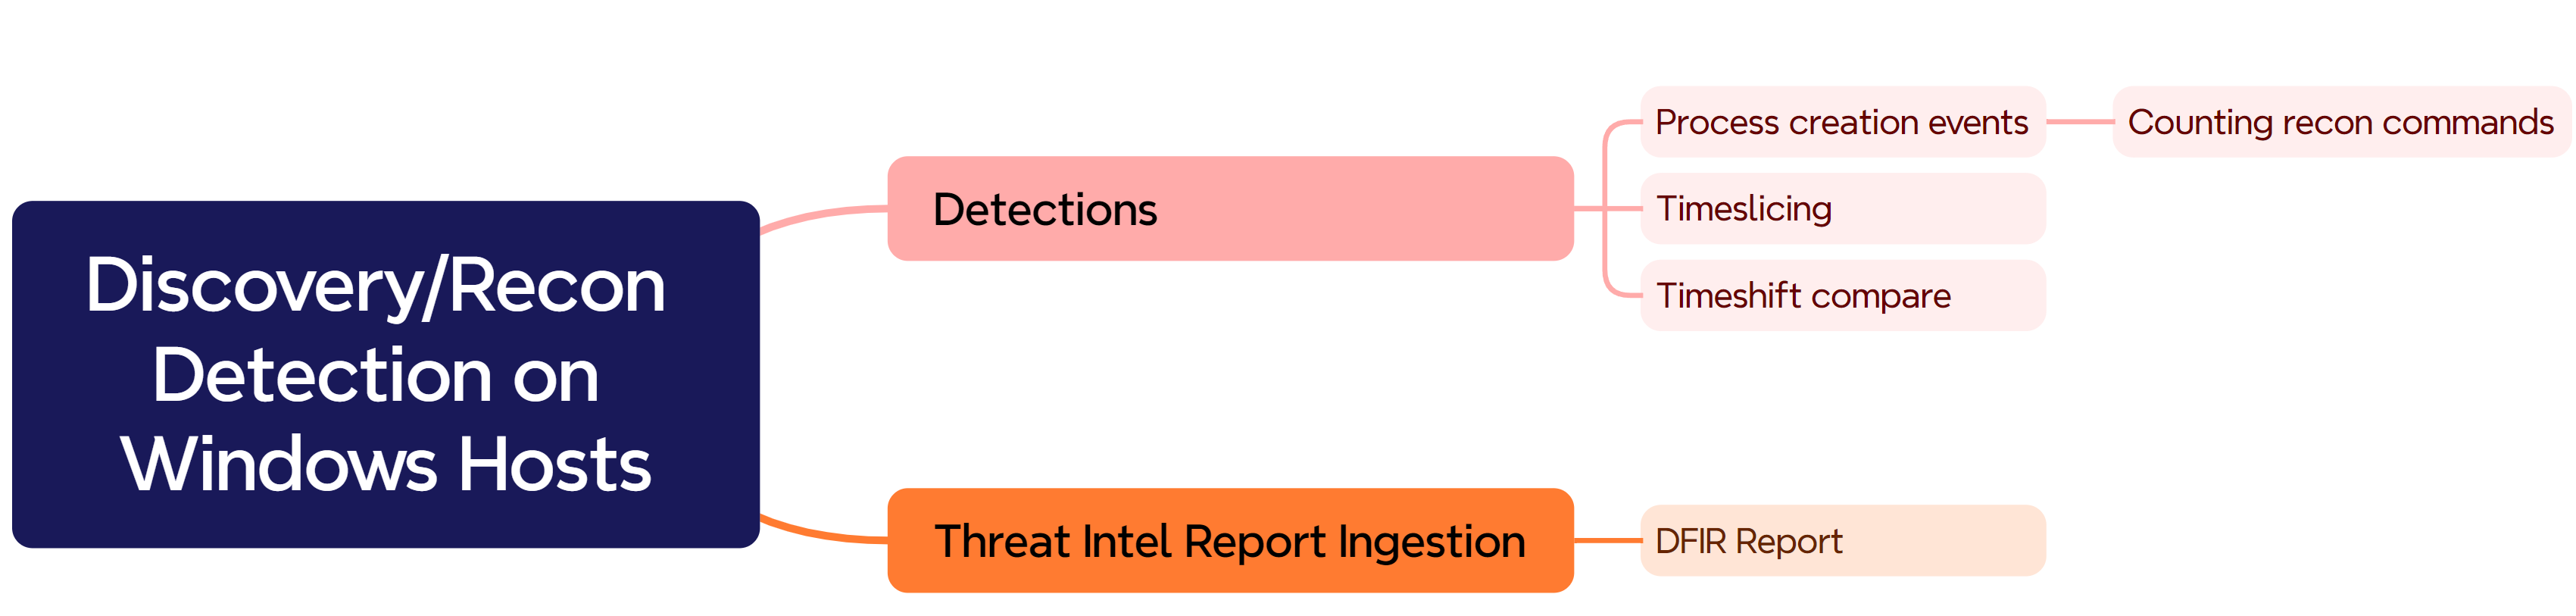
Section mind map